Clingraph: A declarative graph visualizer#
A visualizer for graphs defined as a set of facts that can be computed from logic programs. The graphs are generated using graphviz but are defined via fixed predicates from a list of facts.
The package also contains special features for integration with clingo as well as to create gifs, interactive svg files and latex code!
Tip
Publication
Check out our paper. This work was published in LPNMR22 where it recived the “Best student paper award”.
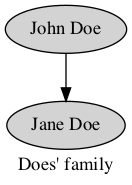
Here is a motivation example:
node(john).
node(jane).
edge((john,jane)).

attr(graph, default, label, "Does' family").

attr(graph_nodes, default, style, filled).
attr(node, john, label, "John Doe").
attr(node, jane, label, "Jane Doe").
Then clingraph will load these facts and construct a graphviz object that can be rendered, saved and more!
Note
Clingraph is part the Potassco umbrella (which is the home of Clingo and the other ASP tools)