Clingraph: A declarative graph visualizer
A visualizer for graphs defined as a set of facts that can be computed from logic programs. The graphs are generated using graphviz but are defined via fixed predicates from a list of facts.
The package also contains special features for integration with clingo as well as to create gifs and latex code!
Here is a motivation example:
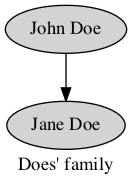
node(john).
node(jane).
edge((john,jane)).

attr(graph, default, label, "Does' family").

attr(graph_nodes, default, style, filled).
attr(node, john, label, "John Doe").
attr(node, jane, label, "Jane Doe").
Then clingraph will load this facts and construct a graphviz object that can be rendered, saved and more!
Note
Clingraph is part the Potassco umbrella (which is the home of Clingo and the other ASP tools)